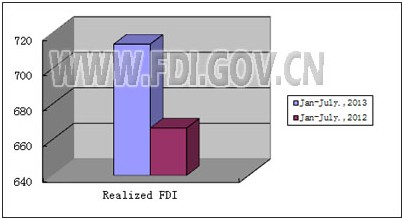
According to statistics, newly approved foreign-invested enterprises amounted to 12,626 from January to July 2013, down by 7.68% year-on-year; and the utilized foreign investment reached USD 71.392 billion, up by 7.09% year-on-year.
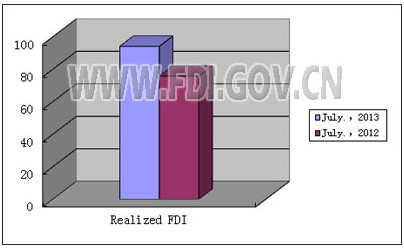
In July 2013, newly approved foreign-invested enterprises amounted to 1,996, up by 1.22% year-on- year; and the utilized foreign investment reached USD 9.408 billion, up by 24.13% year-on-year.
In January-July 2013, the number of newly established enterprises funded by ten Asian countries/regions (Hong Kong, Macao, Taiwan, Japan, the Philippines, Thailand, Malaysia, Singapore, Indonesia and ROK) was 10,199, down by 5.18% year on year, and the actual input were US$ 61.736 billion, up by 7.74% year-on-year. The number of newly established enterprises funded by US was 650, down by 19.05% year-on-year, and the actual input were US$ 2.184 billion, up by 1.144% year-on-year. Number of enterprises funded by EU was 844, down by 14.4% year on year, and the actual input was US$ 4.637 billion, up by 16.72% year-on-year.
In January-July 2013, the top ten countries and regions with investment in China (as per the actual input of foreign capital) are as follows: Hong Kong (USD 45.989 billion), Japan (USD 5.181 billion), Singapore (USD 3.76 billion),Taiwan Province(USD 3.405 billion), U.S.A. (USD 2.184 billion),R.O.K.(USD 2.167 billion),Germany (USD 1.516 billion),Holland (USD 724 million),France (USD 577 million)and Thailand (USD 469 million), total of which accounted for 92.41% of total utilized foreign investment in the country.
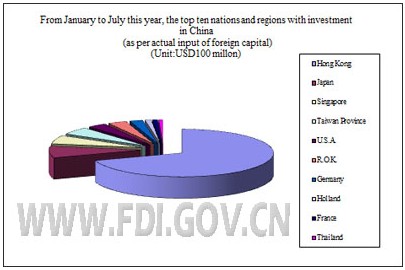
Note: The investment in China by the said countries/regions cover that transferred from free ports of Virgin Islands, Cayman Islands, Samoa, Mauritius and Barbados.
- Americas@zhaoshang.net
- +86-21-68911976
- tjfdiAmericas
- European@zhaoshang.net
- +86-21-68911976
- tjfdiEuropean
- Asian@zhaoshang.net
- +86-21-68911976
- tjAsian